Know what every stopped minute costs — and why it stopped.
A downtime and climate monitoring system for plants that were quoted six figures for an MES and walked away. Connect a simple sensor to the device, provision the device, name your lines and machines, and you are measuring by the end of the shift.
NO MES · NO PLC PROGRAMMING5 MACHINES IN ~15 MINRUNS IN THE CLOUD
Live board — Packer cellSHIFT 1 · 09:41
Uptime
62.4%
Cost today
$14.8k
Down now
3/10
Downtime minutes by hourToday
Downtime minutes by hour for the packer cell today: the two worst hours are 13:00 and 14:00; hours from 15:00 have not run yet.
Packer 01 · Jam/Restart · 1:14Komatsu · 26.8 °C over band
The problem, as it actually happens
Tuesday. The packer stops eleven times.
Nobody is lying to you. The operator restarts the machine, the shift ends, the sheet gets half-filled, and on Friday the clerk keys in what she can read. By the time the number reaches the morning meeting it says “packer — 4.5 hours — miscellaneous”, and the meeting argues about whether that sounds right.
The cost is not the arguing. It is that eleven stops with three different causes get spent as one lump, so the fix goes to the loudest cause instead of the expensive one — and next Tuesday looks exactly the same.
What the paper said
4.5 h · MISC.
What the device saw
6.2 h · 11 STOPS
The same shift, coded as it happenedPACKER 01 · TUE
07:12Film change — planned, on the changeover schedule11 m
08:27Jam / restart — infeed, third time this week74 m
10:04Jam / restart — infeed again, after the humidity climbed51 m
11:38No product — upstream starved the line42 m
13:20Apply teflon tape — sealing jaw, recurring96 m
15:02Six shorter stops — jam, jam, tape, jam, no product, jam98 m
What the pareto says by Wednesday morning
Jam/restart at the infeed owns 54% of the hours and correlates with humidity over 45 %RH. That is one guide adjustment and a HVAC setting change or dehumidifier — not a capital request, and not a mystery.
$50B
Lost across manufacturing every year to unplanned stoppages.
10%
Of capacity the average plant gives up — roughly 1 200 hours of production a year.
0
Trustworthy reason codes on most clipboard systems. You cannot fix what nobody wrote down.
Calculator 01
Put your own numbers on that Tuesday
Labour and overhead keep being paid while the line is stopped, and the margin on everything you did not make walks out the door. The packer above ran six hours down in one shift; below is what a shift like that costs in your plant, not in a case study.
Cost per hour of downtime
$0
Per week
$0
Per year
$0
If coding the stops cuts them by a fifth
$0 / year recovered
In the shift above, two causes owned three quarters of the hours. Plants that start coding stoppages usually find the same shape — which is why a 20% reduction is a conservative first year, not a sales number. A year here is 50 working weeks.
And what the paper system already costs you
A clerk distributing and collecting sheets, an analyst summarizing them, and a report that is three days old when it lands. Run the paper-system calculator and compare it to a subscription.
How it works
Three parts. No integration project.
The reason a mid-market plant can run this and not an MES is that nothing here touches your controls architecture. You are reading a sensor that is already there — isolated from your controls — and asking the operator one question they already know the answer to.
01
The device
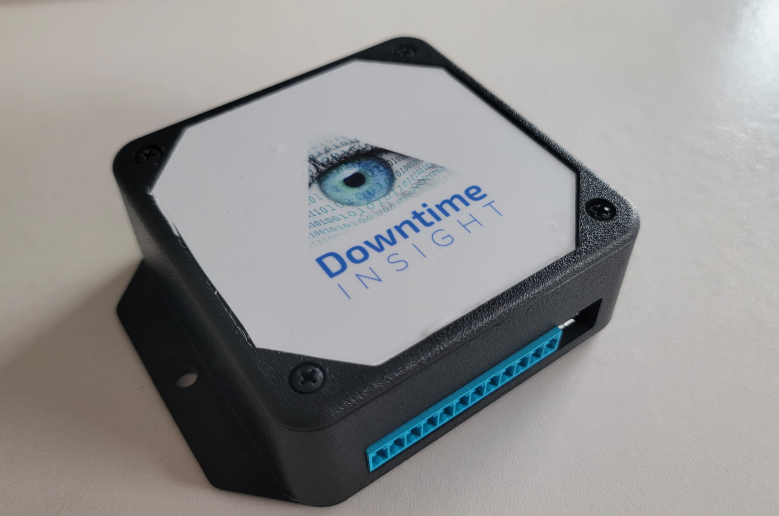
A small 24 VDC device reads a simple sensor already on the machine — an optical sensor, proximity switch, opto-isolator or limit switch — the same signal your cycle light already uses. Temperature and humidity ride along on the same board.
VIN · GND · 24 V DIGITAL INPUT · 2.4 GHZ WI-FI
02
The operator
When a stop is detected, the operator names it from a short list of codes filtered to their machine type. A tablet at the line is enough — no typing, no paper, no clerk keying it in on Friday.
TABLET · PHONE · PC · ANY BROWSER
03
The board
Uptime, OEE, hour-by-hour production and a pareto of causes, per line and per shift — plus climate bands and a record of every excursion. Exportable, and shareable by link.
CLOUD HOSTED · NOTHING TO INSTALL
In service
Machines we are already counting
Four industries, one pattern: a machine whose stops were argued about monthly, wired in an afternoon and settled with a pareto inside two weeks.
Use case in full — Industrial Machine Parts manufacturer
Two presses and a machining cell, argued about for a year
The plant knew the multi-stage CNC cell was the bottleneck and had a quote to replace it. Before signing, they put devices on the two presses feeding it and on the cell itself — nine machines, one afternoon, no controls work.
Two weeks of coded stops showed the cell was starved, not slow: most of its idle hours were NO PRODUCT waiting on press changeovers, and the changeovers themselves were running long because tooling was staged at the wrong end of the line. The cell's own faults were fourth on the pareto.
They moved the tooling stage, split one changeover across two operators, and left the capital request unsigned.
Machines wired
9
To first pareto
14 d
Capital deferred
$1.2M
ILLUSTRATIVE FIGURES — REPLACE WITH THE REAL CUSTOMER NUMBERS BEFORE PUBLISHING
Automotive
Aluminum enclosures — die casting
Cycle-by-cycle performance on a single high-value machine, with shot-to-shot stoppages coded by the operator.
Plumbing components
High-speed die-cut stamping
Output and stoppage cause on one board, so a tooling problem stops being reported as an operator problem.
Automotive glass
Cut & grind line
Line output measured end to end per shift, with climate logged alongside — humidity moves scrap on this process.
Food & confectionery
Packer cells
Ten packers on two shifts — the Tuesday above. Film jams correlated to humidity, fixed without capital.
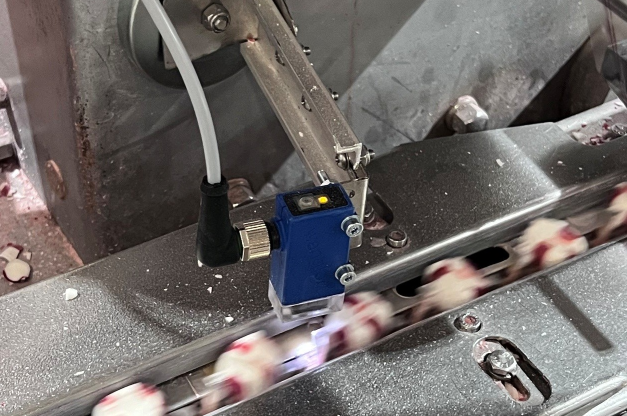
Fig. 1 — The sensor on the line, product going past
Fig. 2 — The device itself, on a plug-in connector
Where this sits
Between the clipboard and the six-figure MES
If you have the budget and the staff for a full MES, buy one. This is for the plant in the middle: real measurement, no integrator, and a number you can cancel.
How Downtime Insight compares with paper and with an enterprise MES
Criterion
Paper & spreadsheet
Enterprise MES
Downtime Insight
Time to first data
Same day, then three days stale
6–18 months
One afternoon
Up-front cost
$0 + clerk hours
$150k+
Device + subscription
Who installs it
Whoever has the clipboard
Integrator, IT, controls
Your maintenance tech
Touches your PLC
No
Yes — programming and validation
No — reads a dry contact
Reason codes
Handwritten, often blank
Full taxonomy, if configured
Short list, filtered per machine type
Environmental (temp / RH)
Not measured
Separate historian project
Same device, same board
Getting out
Recycle the binder
Contract term
Cancel the subscription
Help & support
Everything you need to run it, in one place
Configuration, device provisioning, day-to-day usage and the cost calculators used to sit on four separate pages. They are now seven sections of one support hub — with a plain-language guide to the downtime model itself added between them — and the same left-hand contents on every screen.
01 — Getting started
From box to first board in one afternoon
The order below is the order the app expects. Five machines takes about fifteen minutes of configuration; the wiring is whatever your electrician needs to open the panel.
STEP 01
Create the company
Register an account, enter name, address and timezone. You become the configuration manager.
STEP 02
Set the shifts
Name, start, end and days. Everything downstream is reported per shift, so this comes before the machines.
STEP 03
Lines, machine types, machines
Machine type is what filters the operator's code list — a packer operator should never scroll past press codes.
STEP 04
Downtime codes
Short and honest beats exhaustive. Use “All machine types” for break, lunch, cleaning and scheduled maintenance.
STEP 05
Operators
Invite by email from the Operators tab, or hand out the company registration code and let them self-register.
STEP 06
Wire and provision the device
24 VDC to VIN, 0 V to GND, the machine’s contact to a digital input, then join it to 2.4 GHz Wi-Fi from your phone.
Fig. 3 — Wiring: power in, one shot-contact to input I1
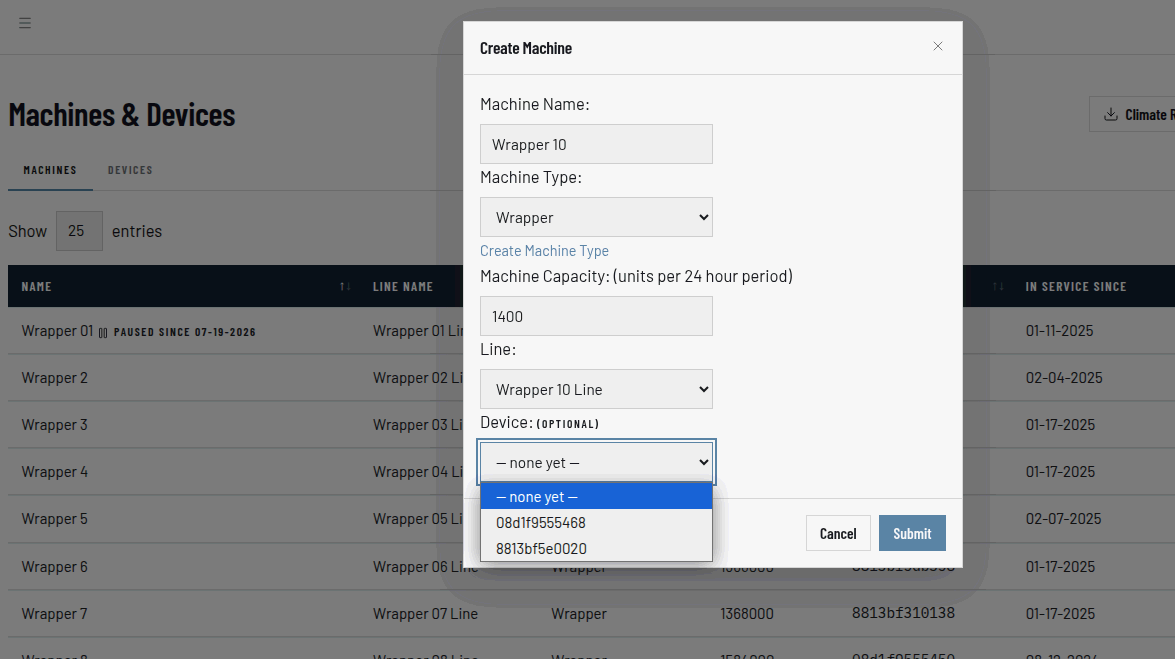
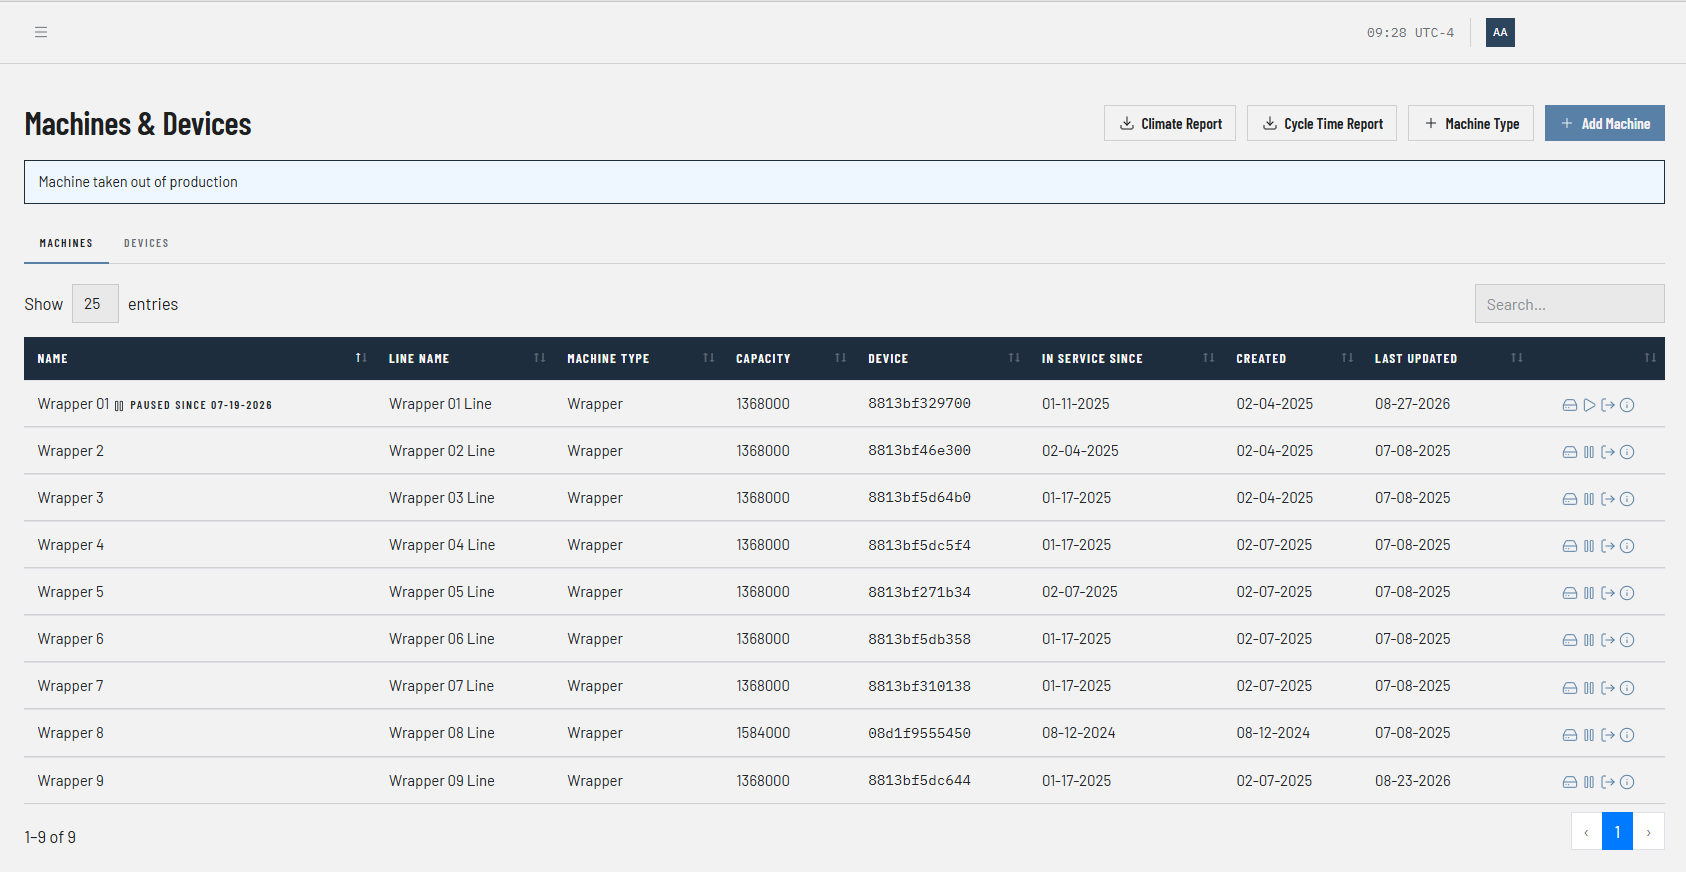
Fig. 4 — Create a machine and assign its device
02 — Configuration
Set it up so the operator never scrolls
Every configuration decision exists to keep the operator's list short. Machine types filter codes; lines group machines for reporting; shifts scope every number on every chart.
Company & timezone
Name, address, and the plant's base UTC offset — every stored timestamp is UTC and rendered back in your local time, daylight saving included. The registration code is generated for you; operators self-register against it. A new company starts on a 30-day trial.
Shifts
A name, a start and end time-of-day, and the days it runs — up to 21 in all (three a day across seven days). A shift crossing midnight is entered with an end time earlier than its start. Every number on every chart is scoped to a shift, so this comes before the machines. A line with no shift assigned is treated as running the full 24 hours.
Lines & machines
A line holds one or more machines. Each machine carries its type, the line it belongs to, and its capacity in units — the figure performance and OEE are measured against, so put a real number in. Capacity comes from the machine's service window and the line's shifts, never from the device.
Machine types
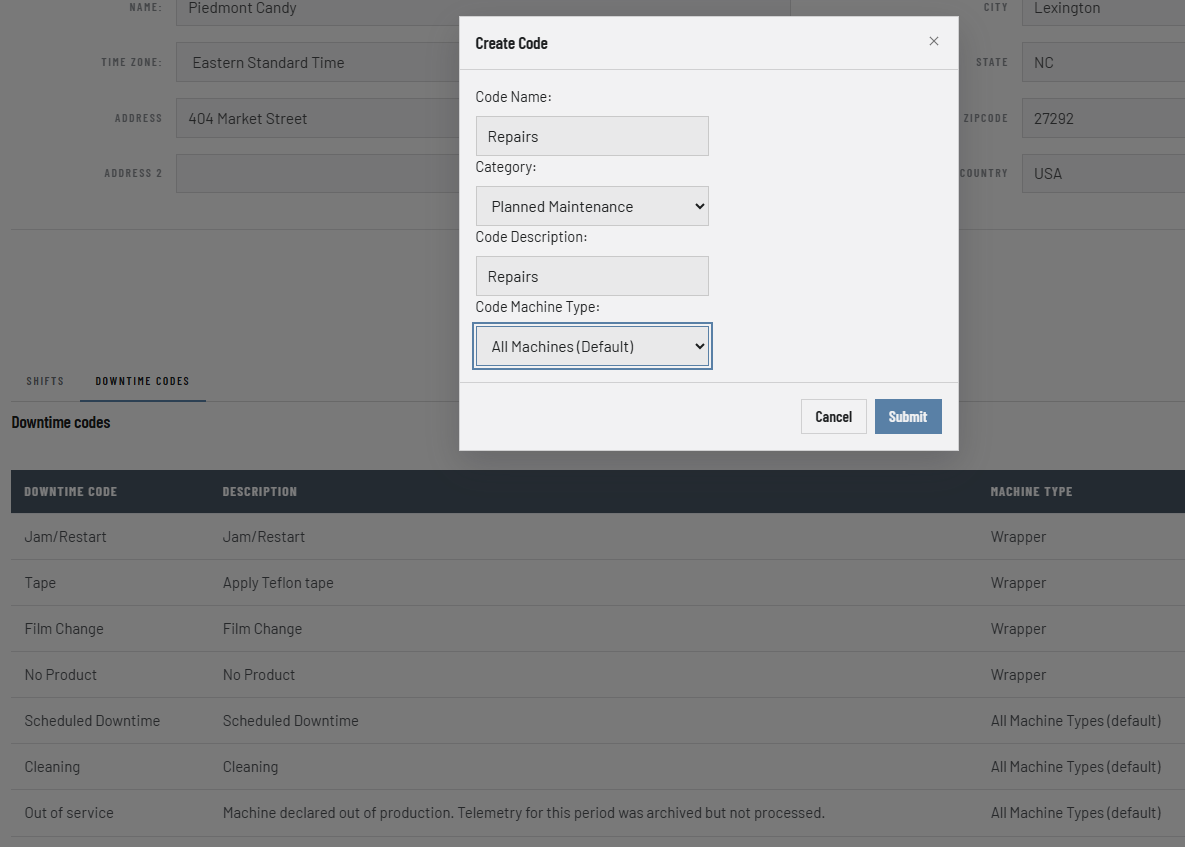
A filter, nothing more. “Packer”, “Press”, “CNC”. Codes assigned to a type only appear for machines of that type; codes assigned to “All machine types” appear everywhere.
Downtime codes
Name, description, machine type, and one of four categories: planned or unplanned, maintenance or operations. The planned/unplanned axis is what the “exclude planned” view keys off — planned changeovers and scheduled maintenance stop dragging down the number you use to chase real losses.
Operators, two ways
Invite by email from the Operators tab, or give out the company registration code from the Company page and let operators self-register against it.
Parts
Optional. A part carries an expected cycle time, so performance is measured against what that product should run rather than one machine-wide rate — and hour-by-hour reports yield per part, not per machine only.
Codes stay short on purpose
Machine types filtering codes, and “All machine types” for the universal ones — break, lunch, cleaning, scheduled maintenance — exist so the operator's list never scrolls. A packer operator should never pass a press code to reach a jam.
PASSWORD RULE: 6+ CHARACTERS, ONE NUMBER, ONE UPPER, ONE LOWER, ONE SPECIAL
Fig. 5 — A downtime code: name, category and machine-type scope
03 — Device provisioning
Power, contact, Wi-Fi
Three connections and one network join. Figures below are for the v0 hardware.
WIRING
24 VDC in
Supply to VIN, 0 V / return to GND. Confirm polarity and voltage before applying power.
WIRING
Relay contact
Normally-open contact wired between 24 V and a digital input (I1–I3). The small green RC board debounces electromechanical signals — fit it on relay and switch contacts.
NETWORK
2.4 GHz only
Attach the antenna first. On power-up the display shows “configuring WiFi”, then broadcasts an access point named dti-esp32-xxxxxx.
Joining the network
Connect your phone to the dti-esp32-xxxxxx network. If the setup page does not open by itself, browse to 192.168.4.1.
Choose Configure WiFi, pick your SSID, enter the password, save.
Wait about thirty seconds. The display shows the cloud, Wi-Fi and time icons plus the device ID when it is connected.
Register that device ID against a machine in the app under Machines & Devices.
Set up one, not dozens
You only join one device to Wi-Fi by hand. Once a device is on the network it quietly becomes a donor: any of your other devices powered up within range picks up the same Wi-Fi credentials from it over a short-range Bluetooth link — encrypted, and shared only between devices provisioned for your account, so the password is never broadcast or typed twice. Power up a bench of them and they come online on their own; a device only falls back to the dti-esp32-xxxxxx portal above if it can't find a donor.
04 — Downtime concepts
What the numbers are made of
Every chart in the product is built from four ideas stacked on each other:
Place — where the stop happened.
State — what the machine and its line are in.
Event — the stop itself, opened and closed.
Reason — the code it is given, by a rule or by a person.
Understand these four and you can read any chart in the product without a manual.
The structure
Everything hangs off a three-level topology, plus shifts:
Company — owns its lines.
Line — holds one or more machines.
Machine — the thing that actually stops.
Shifts — decide which hours are counted at all.
Every downtime event, every count and every climate reading hangs off a single machine and rolls up through its line to the company.
A machine's life
A machine is commissioned on a date and runs against its line's shifts from then on. Those dates are its service window — the span that fills the capacity every percentage is measured against — so a machine contributes nothing before it existed and nothing after it is retired.
Paused, or retired
Two ways a machine leaves production, and they are not the same:
Pause production — parks a machine temporarily: it keeps its share of scheduled time and the gap is booked as a planned outage, because it is coming back.
Take out of production — retires it for good: it stops filling capacity from that moment, releases its device, and closes any stop still open.
Either way it stays on the charts for the period it actually ran.
What a machine is showing right now
Four words, the same on every screen:
Running — making product.
Down — the red alarm: either the device has gone dark (silent, or never yet heard from) or a stop is open during a shift.
Stopped — a stop that is open outside the line's shift hours: not producing, but nobody was scheduled to run it, so it is flagged, not alarmed.
Paused — deliberately taken out of production, which is a choice, not a fault.
There is no separate “offline” or “idle” for a machine: an offline machine reads as Down, and “idle” is a line word.
A line is never “down”
A line has a production state, not a fault:
Running — in a shift, with any of its machines producing.
Stopped — in a shift, with nothing producing: every machine paused, stopped or down.
Idle — off its own shifts: nobody was meant to run it, so a stopped machine on it is not something to chase.
Carries a down machine — a separate alarm counted alongside, not a state: it can sit on top of any of the above, so a running line can still have one machine down.
A downtime event, open then closed
A stop has two states over its life:
Open — from the moment a machine goes down, counting against the clock right up to this minute. An open event is not missing data; it is a machine that is down now, and while it is open it cannot be coded or deleted, because its duration is not final yet.
Closed — sealed on the matching restart, its duration now final and ready to be coded.
Two ways a stop is entered
Either way it lands on one machine, timestamped, waiting for a reason:
Automatically — from the device wired to the machine: a stop signal, or the device itself going quiet, which opens an event with no end that keeps counting.
By hand — when an operator opens their line and taps the open stop.
Automatic classification
You write the rules once — for example, every stop under 90 seconds is a jam/restart — and give them a priority order. When an event closes, the engine matches it against your rules and stamps the code with no one touching it. It only ever fills a blank; it never overwrites a code a person chose.
Manual classification, and who wins
An operator picks a code from the list filtered to their machine; a manager can add, split or re-code any event afterward from the Downtime page. The product records who set each code — the device, an automatic rule, or a person — and a person's choice always outranks an automatic one.
Why the category matters
Every code carries one flag:
Planned — the changeovers and maintenance you scheduled for.
Unplanned — the losses you can attack.
That one flag is what lets a chart separate the two — the difference between “we lost six hours” and “we lost six hours we can do something about.”
Fig. 6 — A machine's lifecycle: paused, resumed, or taken out of production
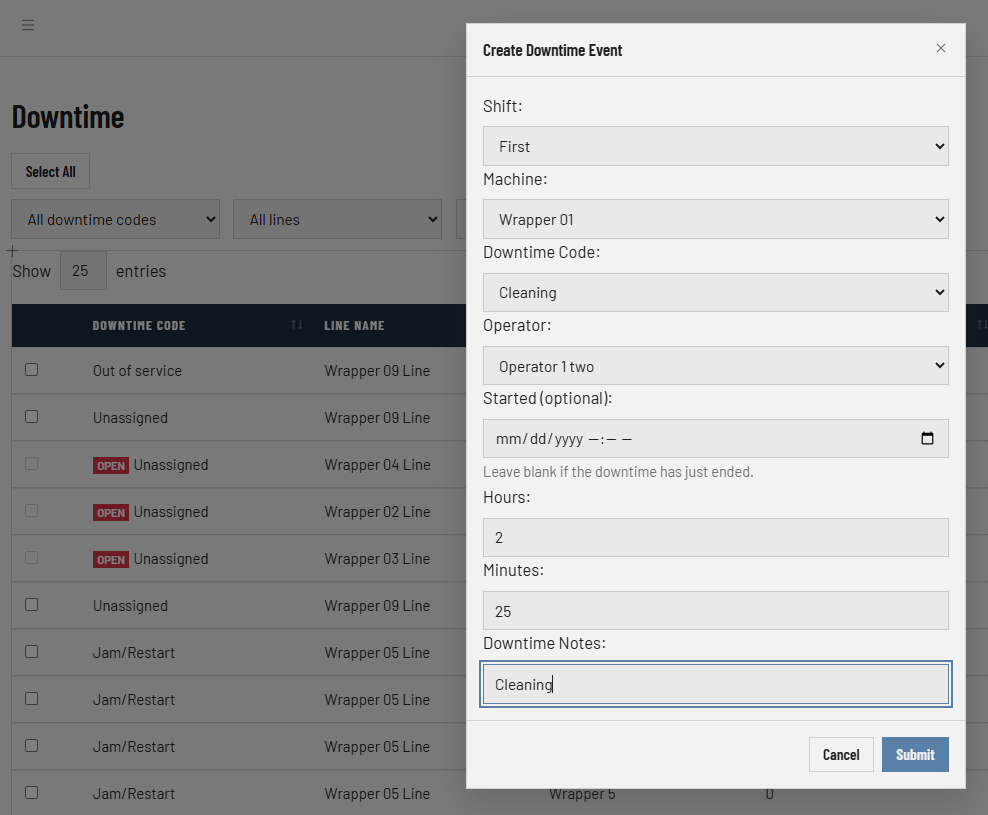
Fig. 7 — Coding a stop by hand; OPEN events are still counting, “Unassigned” ones await a code
05 — Daily use & charts
What to look at, and in what order
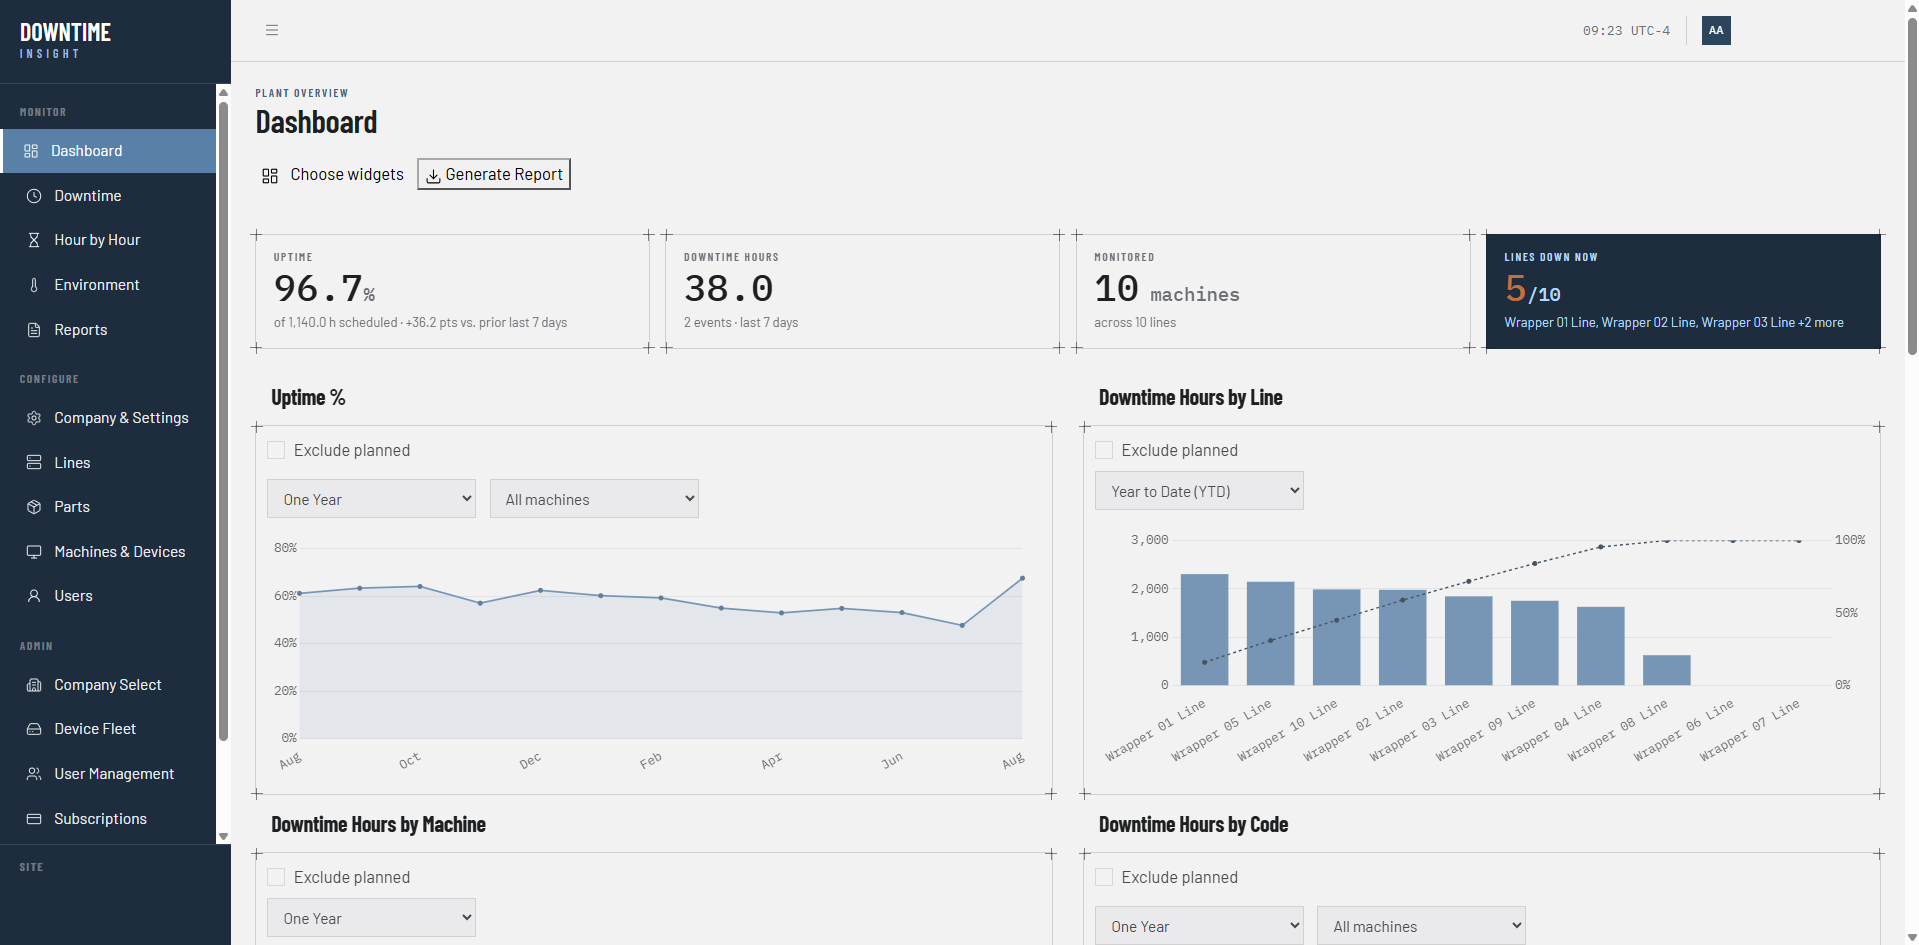
The dashboard is arranged the way a morning meeting should run: what is down now, where the trend is going, which cause owns the hours, then the detail.
Reading a pareto
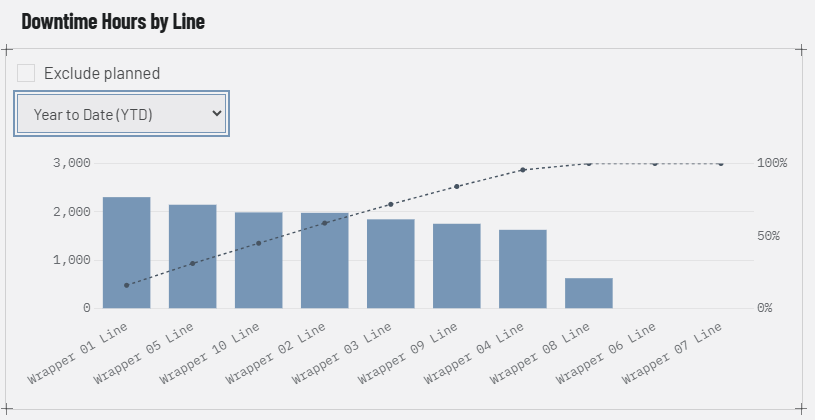
Bars are sorted worst first; the dashed line is cumulative. Where it crosses 80% you have found the short list worth fixing. Everything to the right of that is noise this month.
Exclude planned
One page-level switch. On, you are looking at losses you can attack; off, you are looking at total capacity. Say which one you are quoting in a meeting.
Hour by hour
Per line, per date: good parts, unplanned downtime minutes, performance, availability and OEE for each hour, with a comment field. This is where a supervisor explains an hour, not the whole shift.
Entering a stop
The operator opens their line, taps the open stop, and picks a code from the filtered list. A manager can add, split or re-code an event afterwards from the Downtime page.
Climate
Temperature and humidity against the band you configured, per machine, with every excursion and its duration kept. Overlay it on downtime when you suspect a correlation.
Getting it out
Any chart or table exports to CSV, and any filtered view can be shared as a link — the filters travel in the URL.
Fig. 8 — The board: what is down now, and where the trend is going
Fig. 9 — Downtime by line as a pareto, worst cause first
06 — Cost calculators
Four numbers worth having before you buy anything
The main downtime cost calculator is on the front page. These three support it, and all four run entirely in your browser.
CALC 02
Contribution margin
Selling price per unit less raw material, energy, labour and overhead per unit — then multiplied by your rate to give margin lost per hour stopped.
CALC 03
Paper system cost
Sheets, clerk hours distributing and collecting them, analyst hours summarizing and updating reports. Most plants are surprised by the annual figure.
CALC 04
ROI
Annual downtime savings against annual investment. Use the recovered figure from calculator 01 as the input and keep the assumption conservative.
A note on honesty: the recovery assumption on the front page is 20%. Change it in your own head if you like — the calculator's value is that it makes the assumption visible instead of burying it in a proposal.
07 — Troubleshooting
When the device will not report
It will not join the network
The radio is 2.4 GHz. A 5 GHz-only SSID will never appear. Check the band, then check that the SSID is broadcast and the password is right.
The display is blank
Verify 24 VDC at Vin and common at Com, and that the antenna is seated. A wrong supply voltage is the usual cause.
Counts look doubled
Contact bounce. Fit the RC debounce board on the relay or switch contact.
Data lands on the wrong machine
The device ID is registered against another machine. Check it under Machines & Devices — the ID printed on the display is authoritative.